


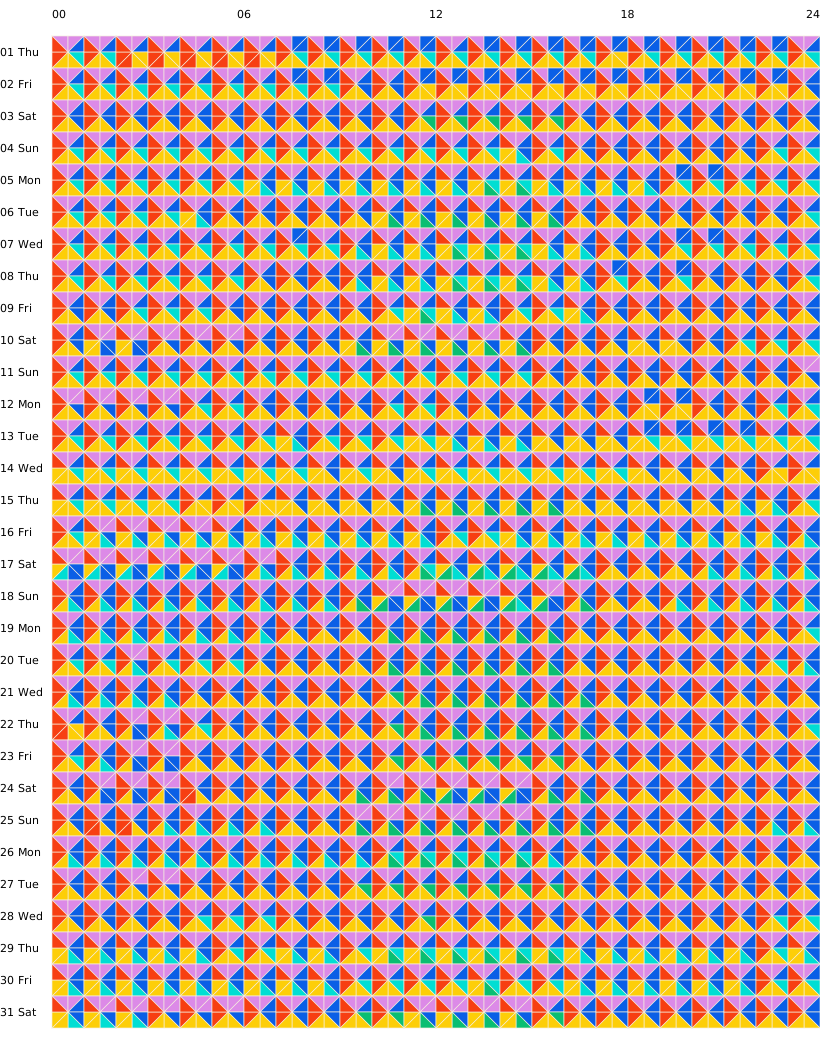
Each row is a day, midnight to midnight. Each square is an hour, cut into eight pieces by each source's share of the power generated in New York.
- Nuclear
- Hydro
- Wind
- Solar & other renewables
- Dual fuel
- Natural gas
- Oil & other fossil
Hover a row to focus a day. Click it to see the details.
October 2026
New York Power Quilt
A month of electricity generated in New York.
About this data artwork
What would a month of electricity generated in New York State look like as a quilt?
New York Power Quilt turns the state’s changing mix of electricity sources into an evolving artwork. Color and pattern emerge from the data, revealing the shifts in how we generate power over the course of a day and across a month.
How to read it
Each block is cut into eight triangles, each roughly one-eighth of the power generated in that hour. This one is two-eighths nuclear, two hydro, one wind, two dual fuel and one natural gas.
Colors always go clockwise from the top-left in the same order: nuclear, hydro, wind, solar and other renewables, dual fuel, natural gas, oil. Small sources may not earn a triangle, but they still count in the numbers. Hover over a block to see its readings in megawatts.
The data
NYISO publishes the state's fuel mix about every five minutes. Readings are averaged into fifteen-minute intervals, then into hours. Imported power isn't included. Blank squares are hours with incomplete readings. Times are Eastern. "Oil and other fossil" is NYISO's Other Fossil Fuels category. Dual-fuel plants, which can burn gas or oil, are counted separately.
Source: NYISO Real-Time Fuel Mix
Data: NYISO. Concept and design: Great Big Yarn. Built with Claude Code and Codex.
Selected day